

fabro run.
Anatomy of a workflow
Every workflow is adigraph with a goal, a start node, an exit node, and one or more processing nodes connected by edges:

my-workflow.fabro
goal attribute describes what the workflow accomplishes. Fabro uses it to guide agent behavior.
Key node types
Each node’s Graphviz shape determines how it executes. The three most important types are: Agents (defaultbox shape) run an LLM with access to tools — bash, file editing, sub-agents — looping autonomously until the task is complete:
parallelogram) run shell scripts and capture output for downstream nodes:
hexagon) pause the workflow and wait for a person to choose a path. Edge labels define the options:
Branching and loops

max_visits on a node to prevent infinite loops:
Parallel execution

Goal gates
Mark critical nodes withgoal_gate=true. The workflow fails if any goal gate doesn’t succeed — even if execution reaches the exit node:
Running a workflow
From the CLI: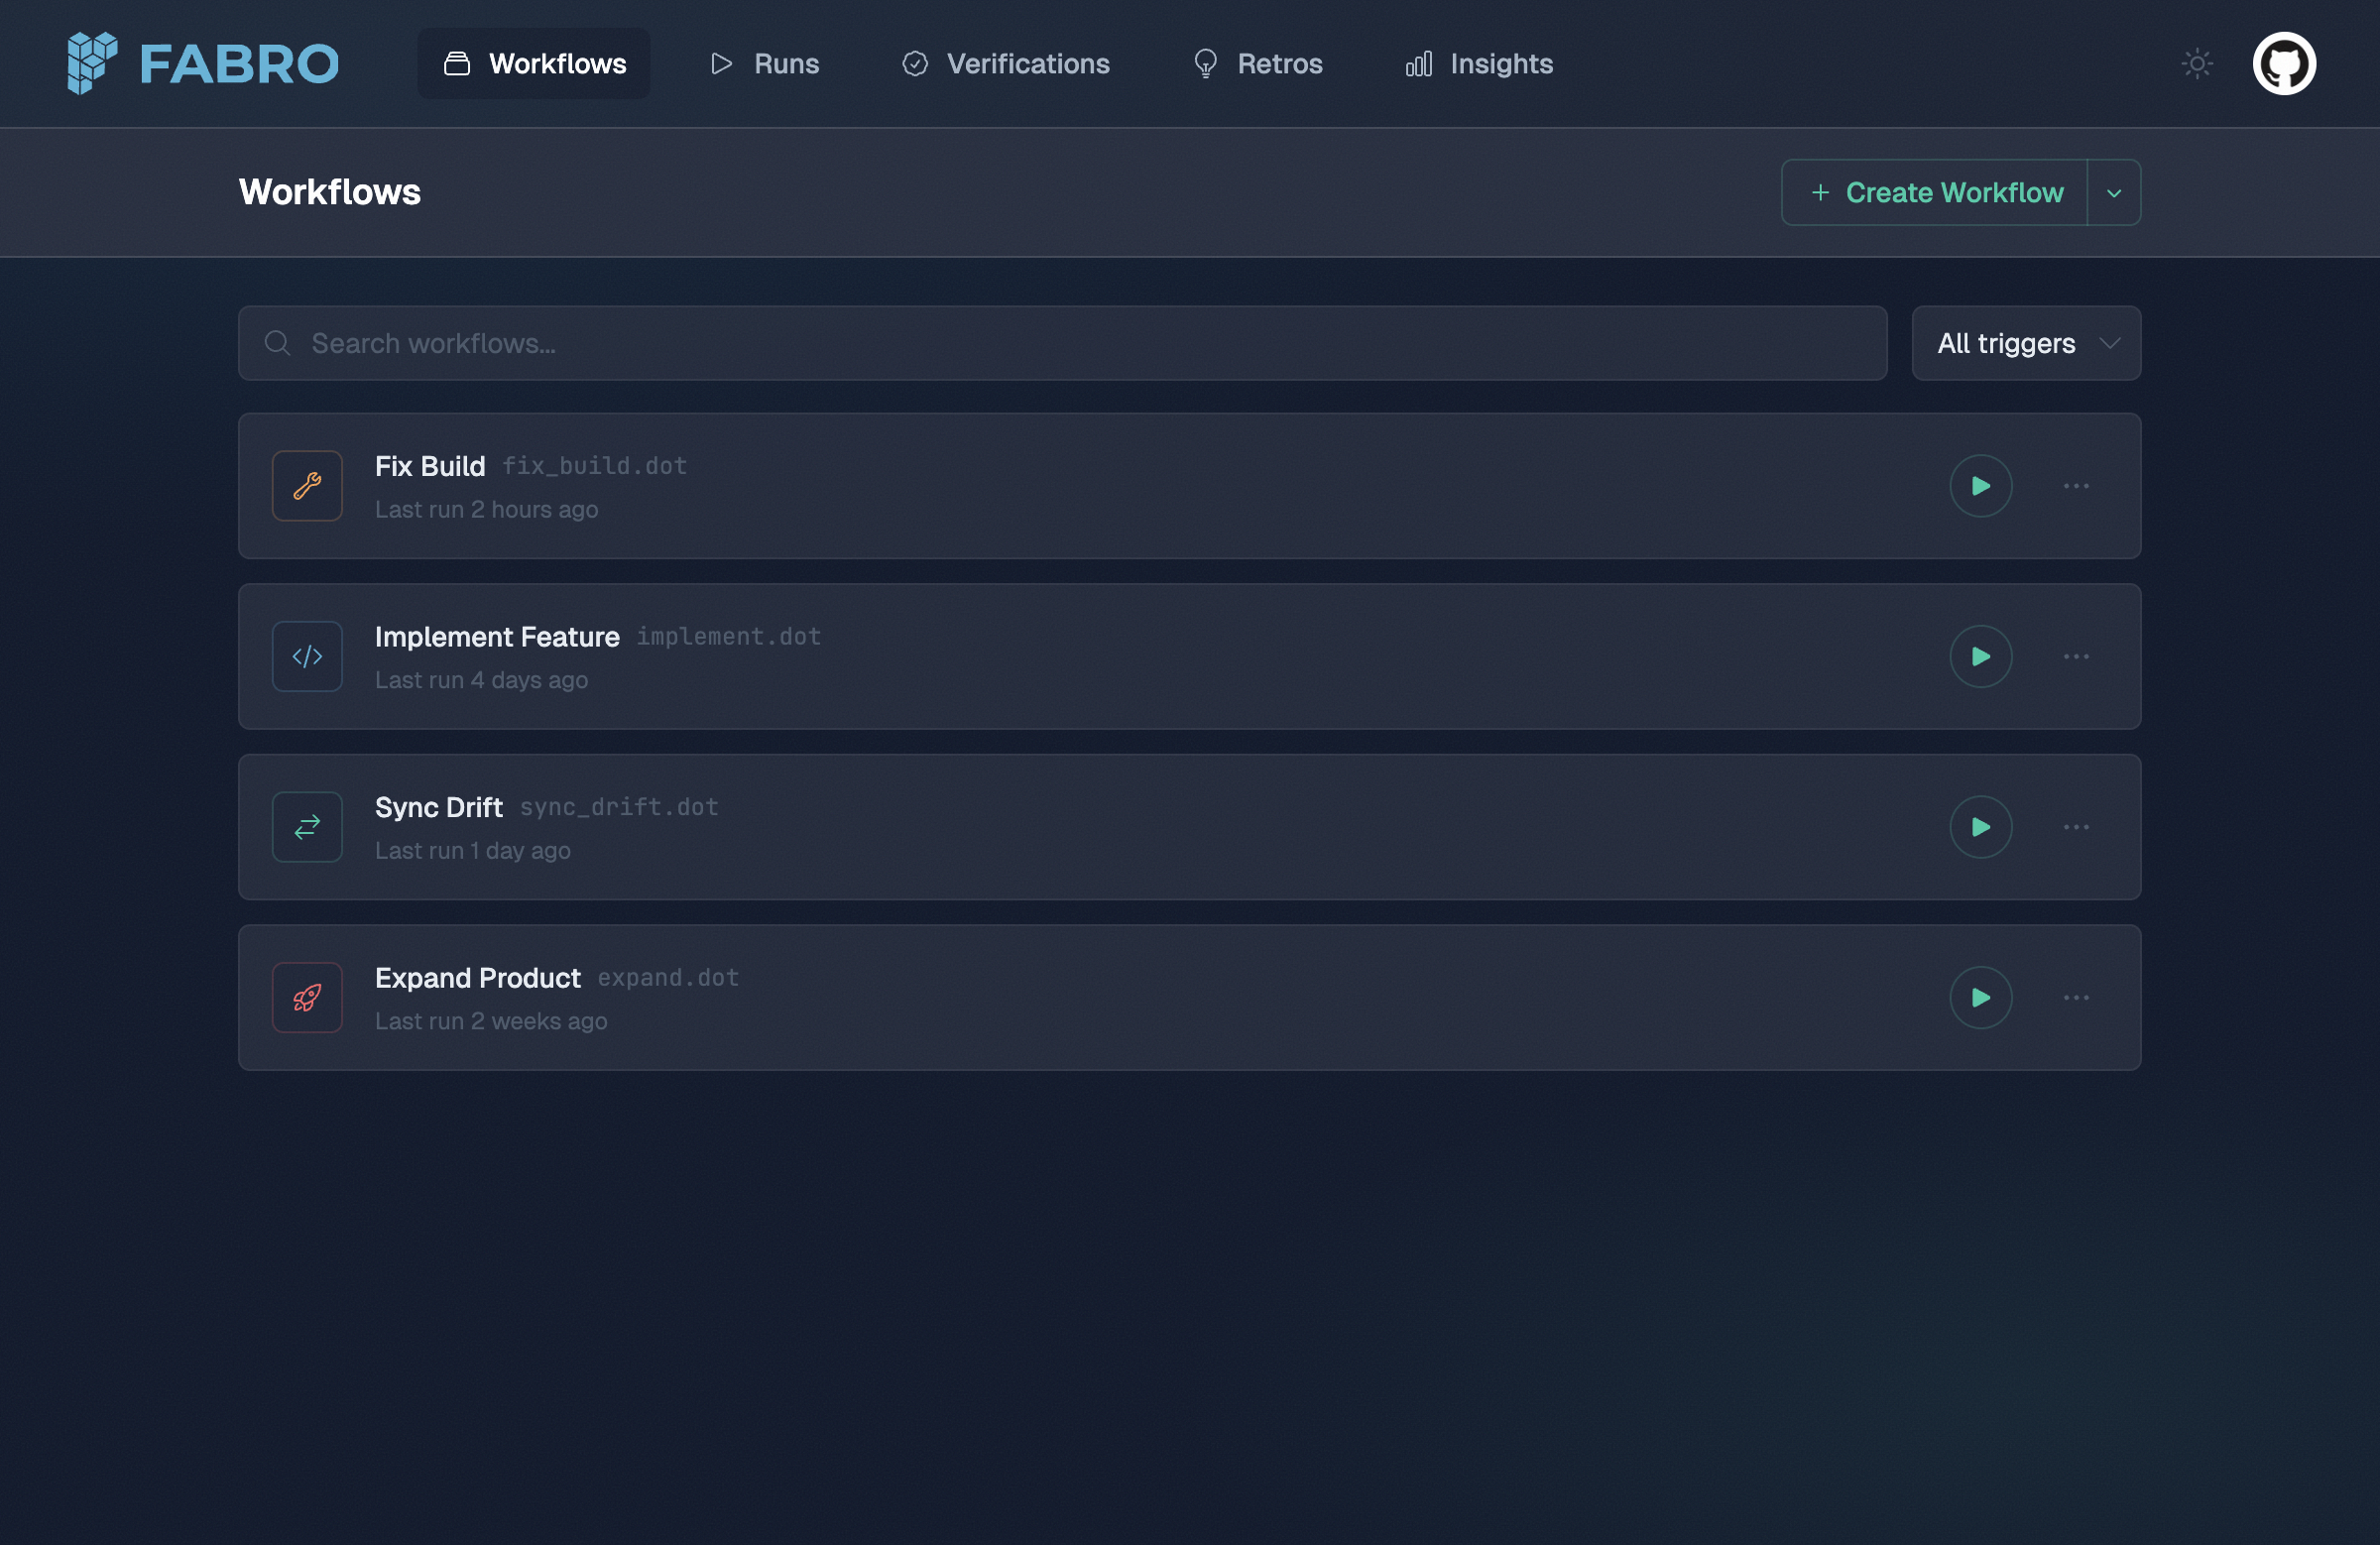
The Workflows page lists all available workflows with their trigger type and last run time.
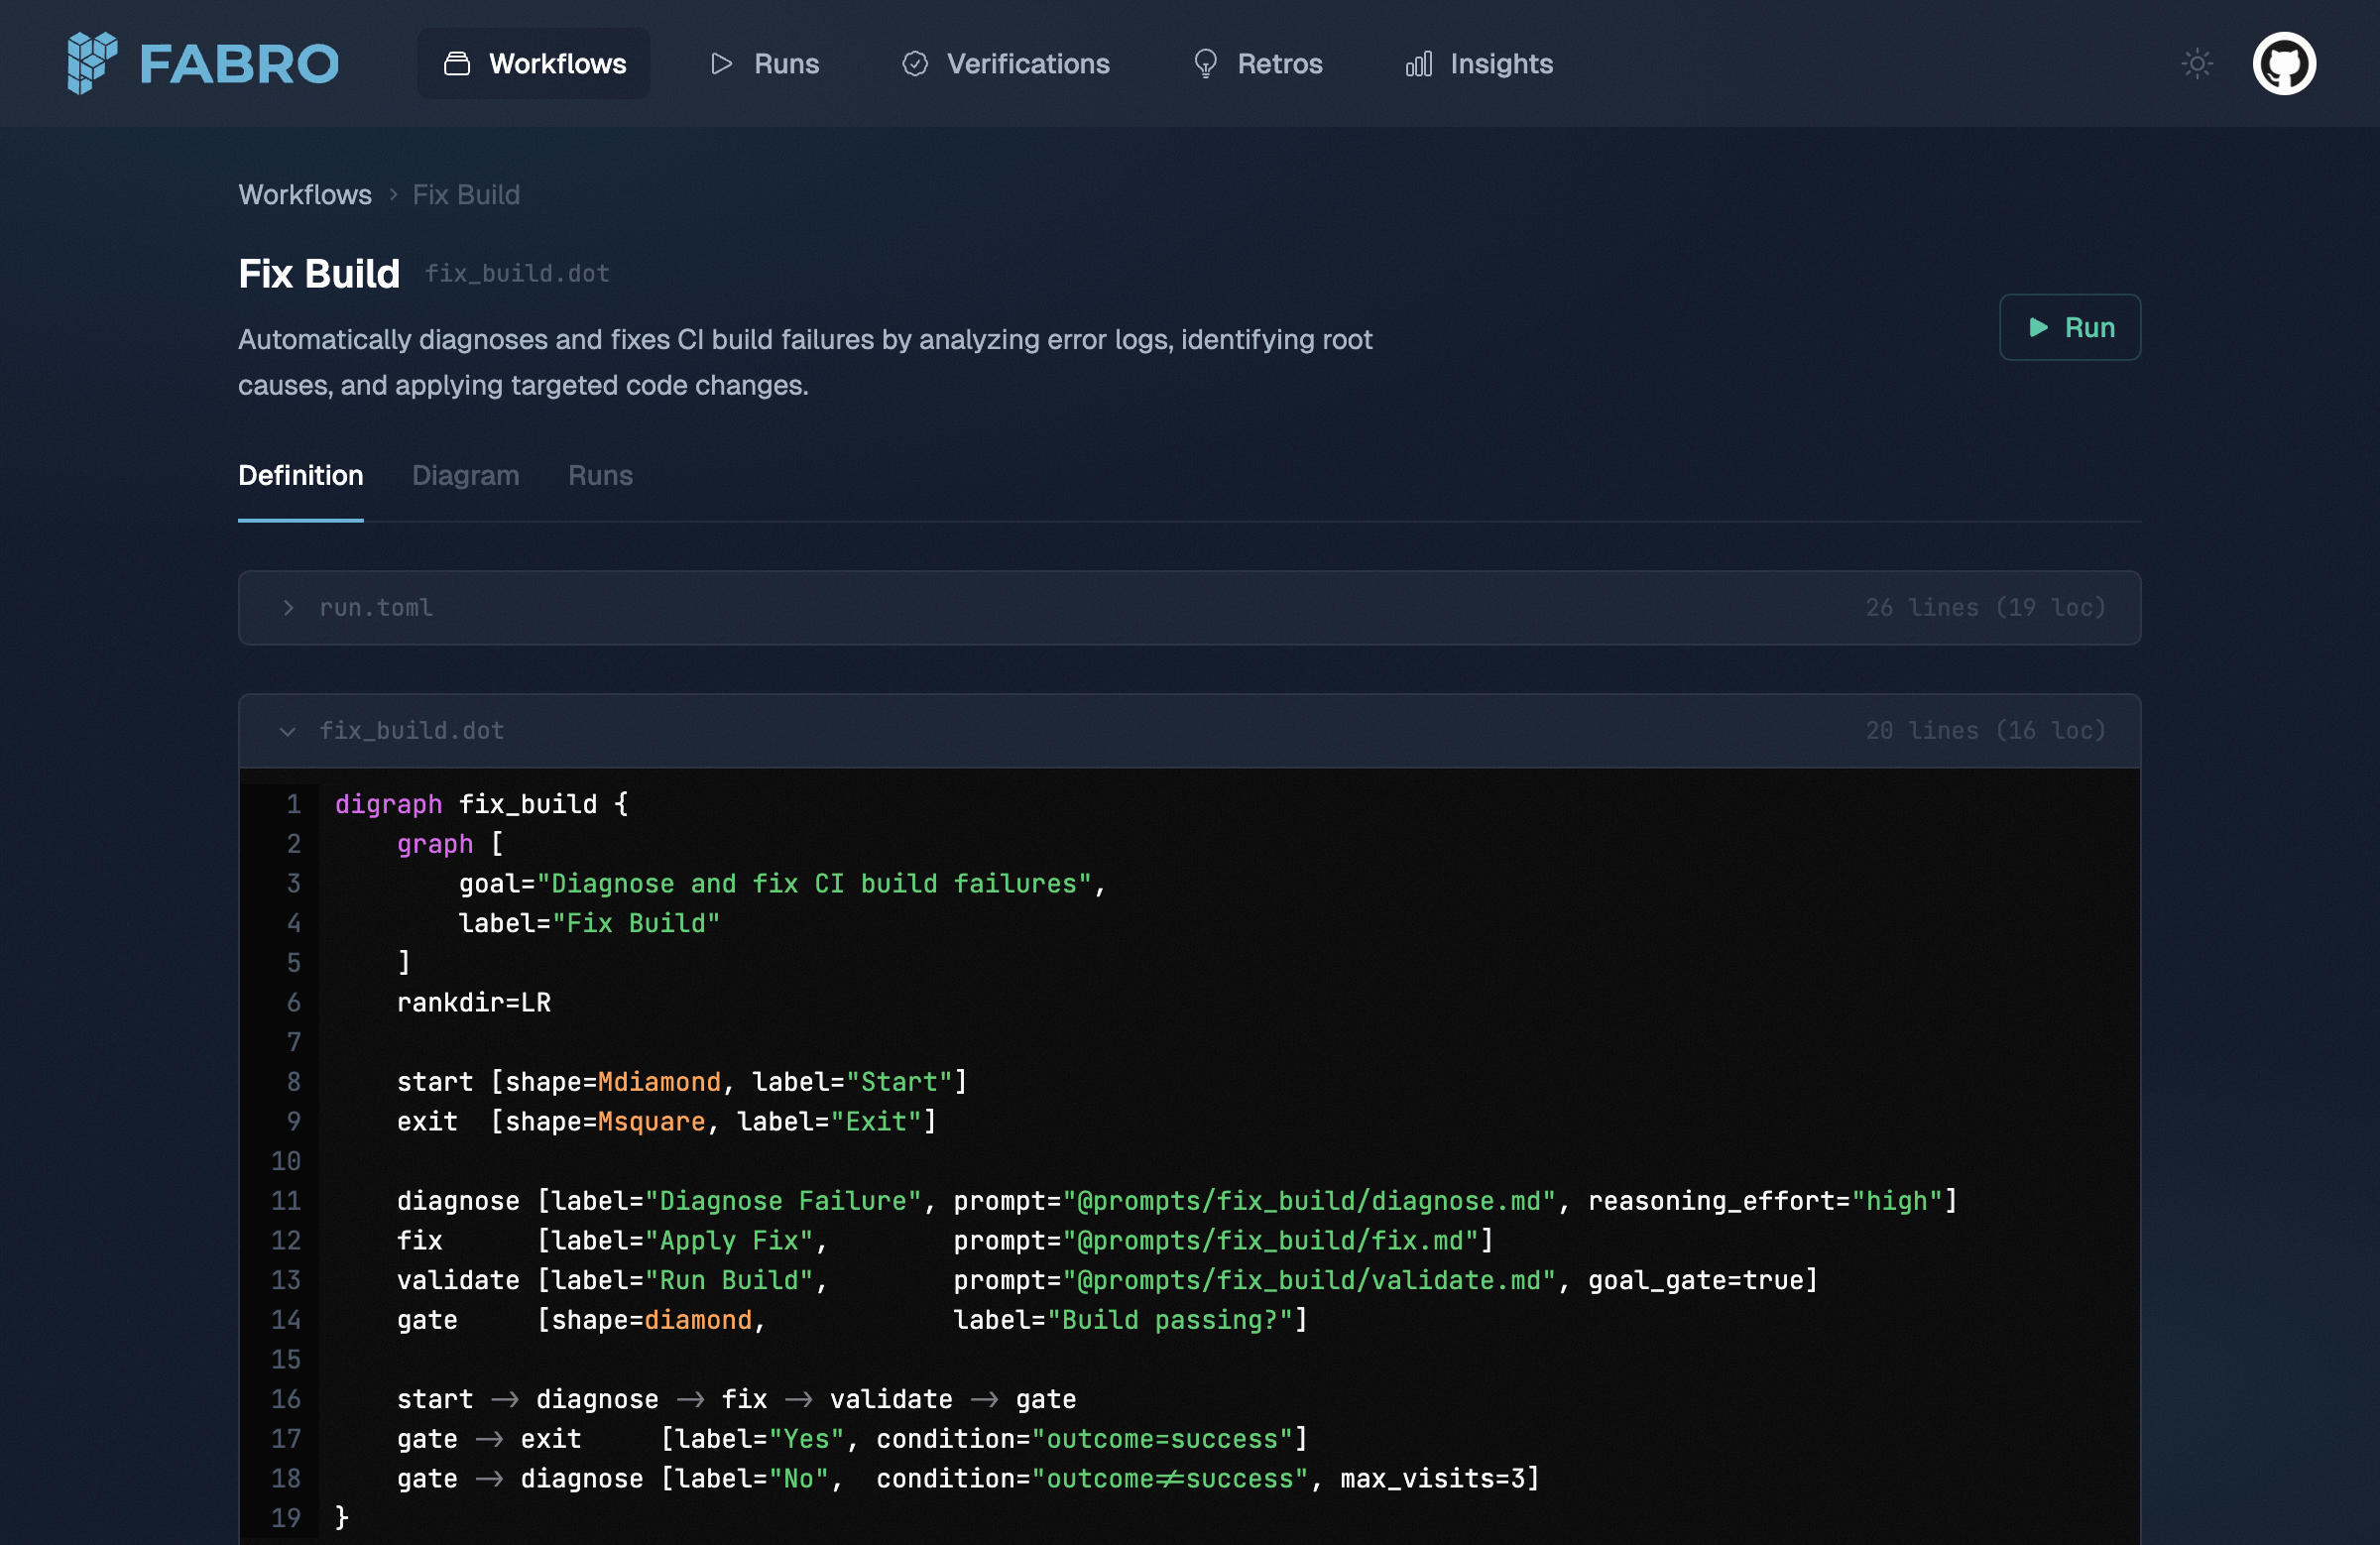
The workflow detail view shows the Graphviz definition with syntax highlighting.
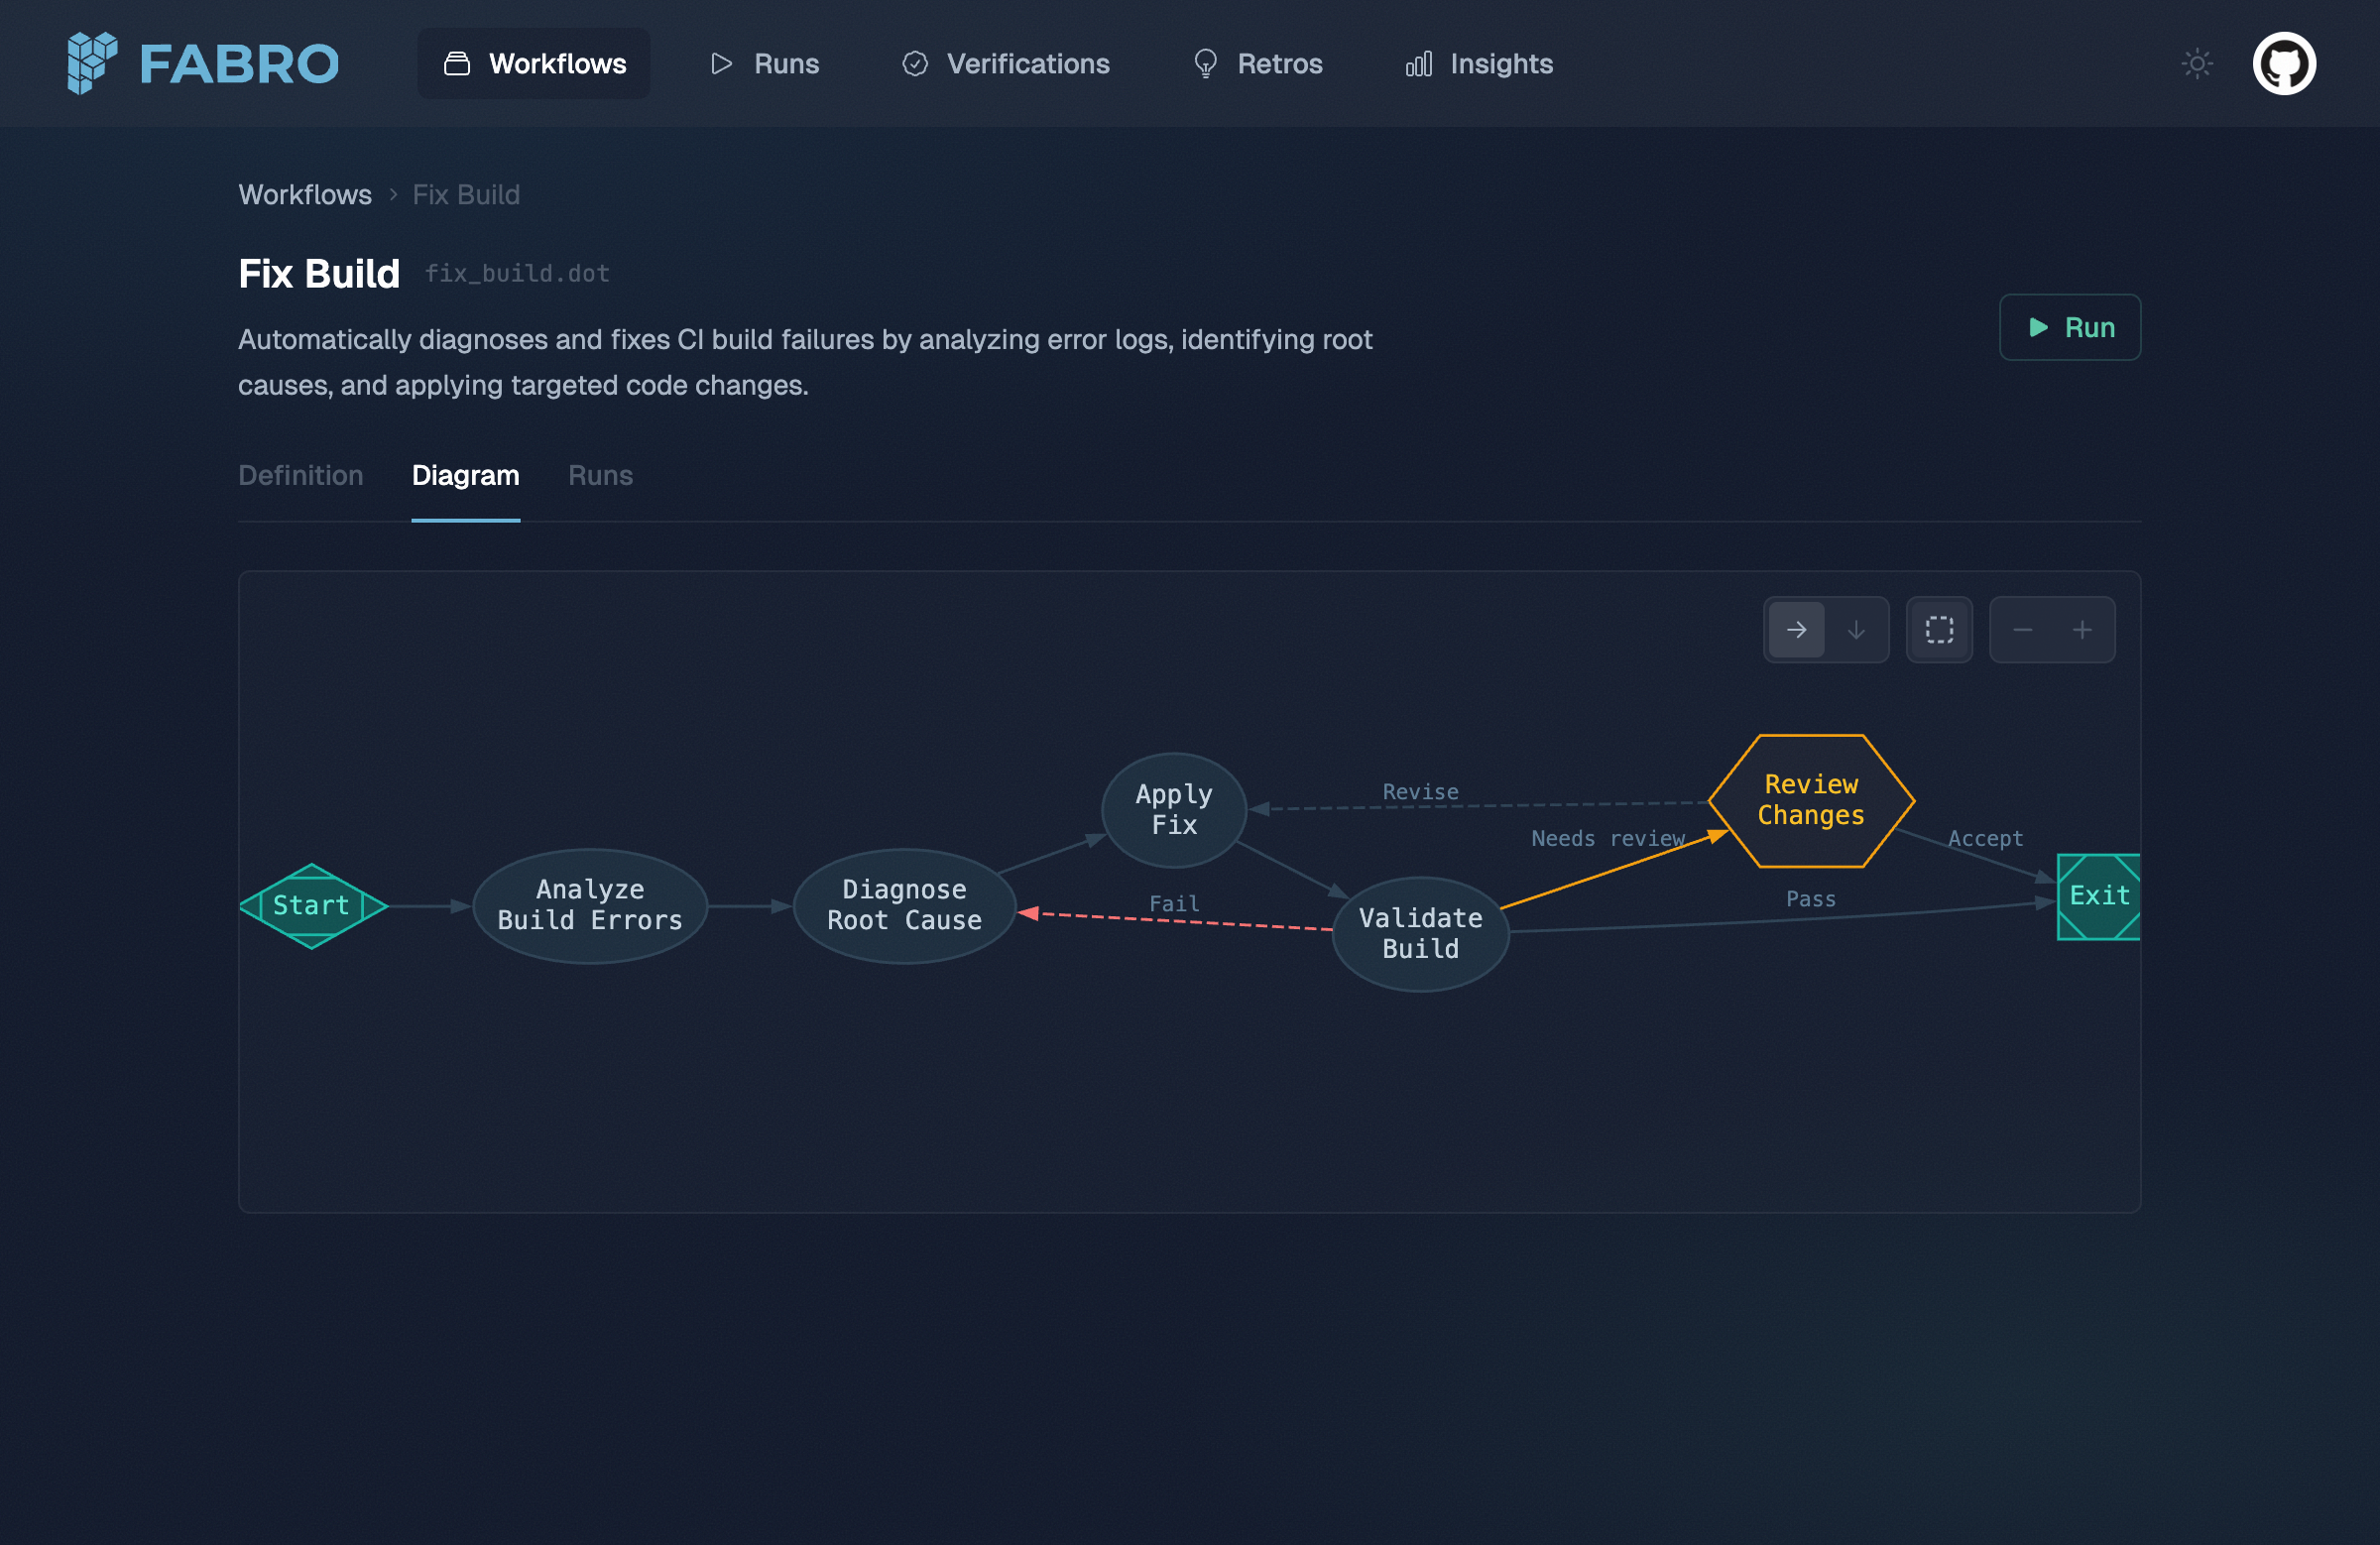
The Diagram tab renders the workflow graph visually, showing nodes, edges, and conditions.
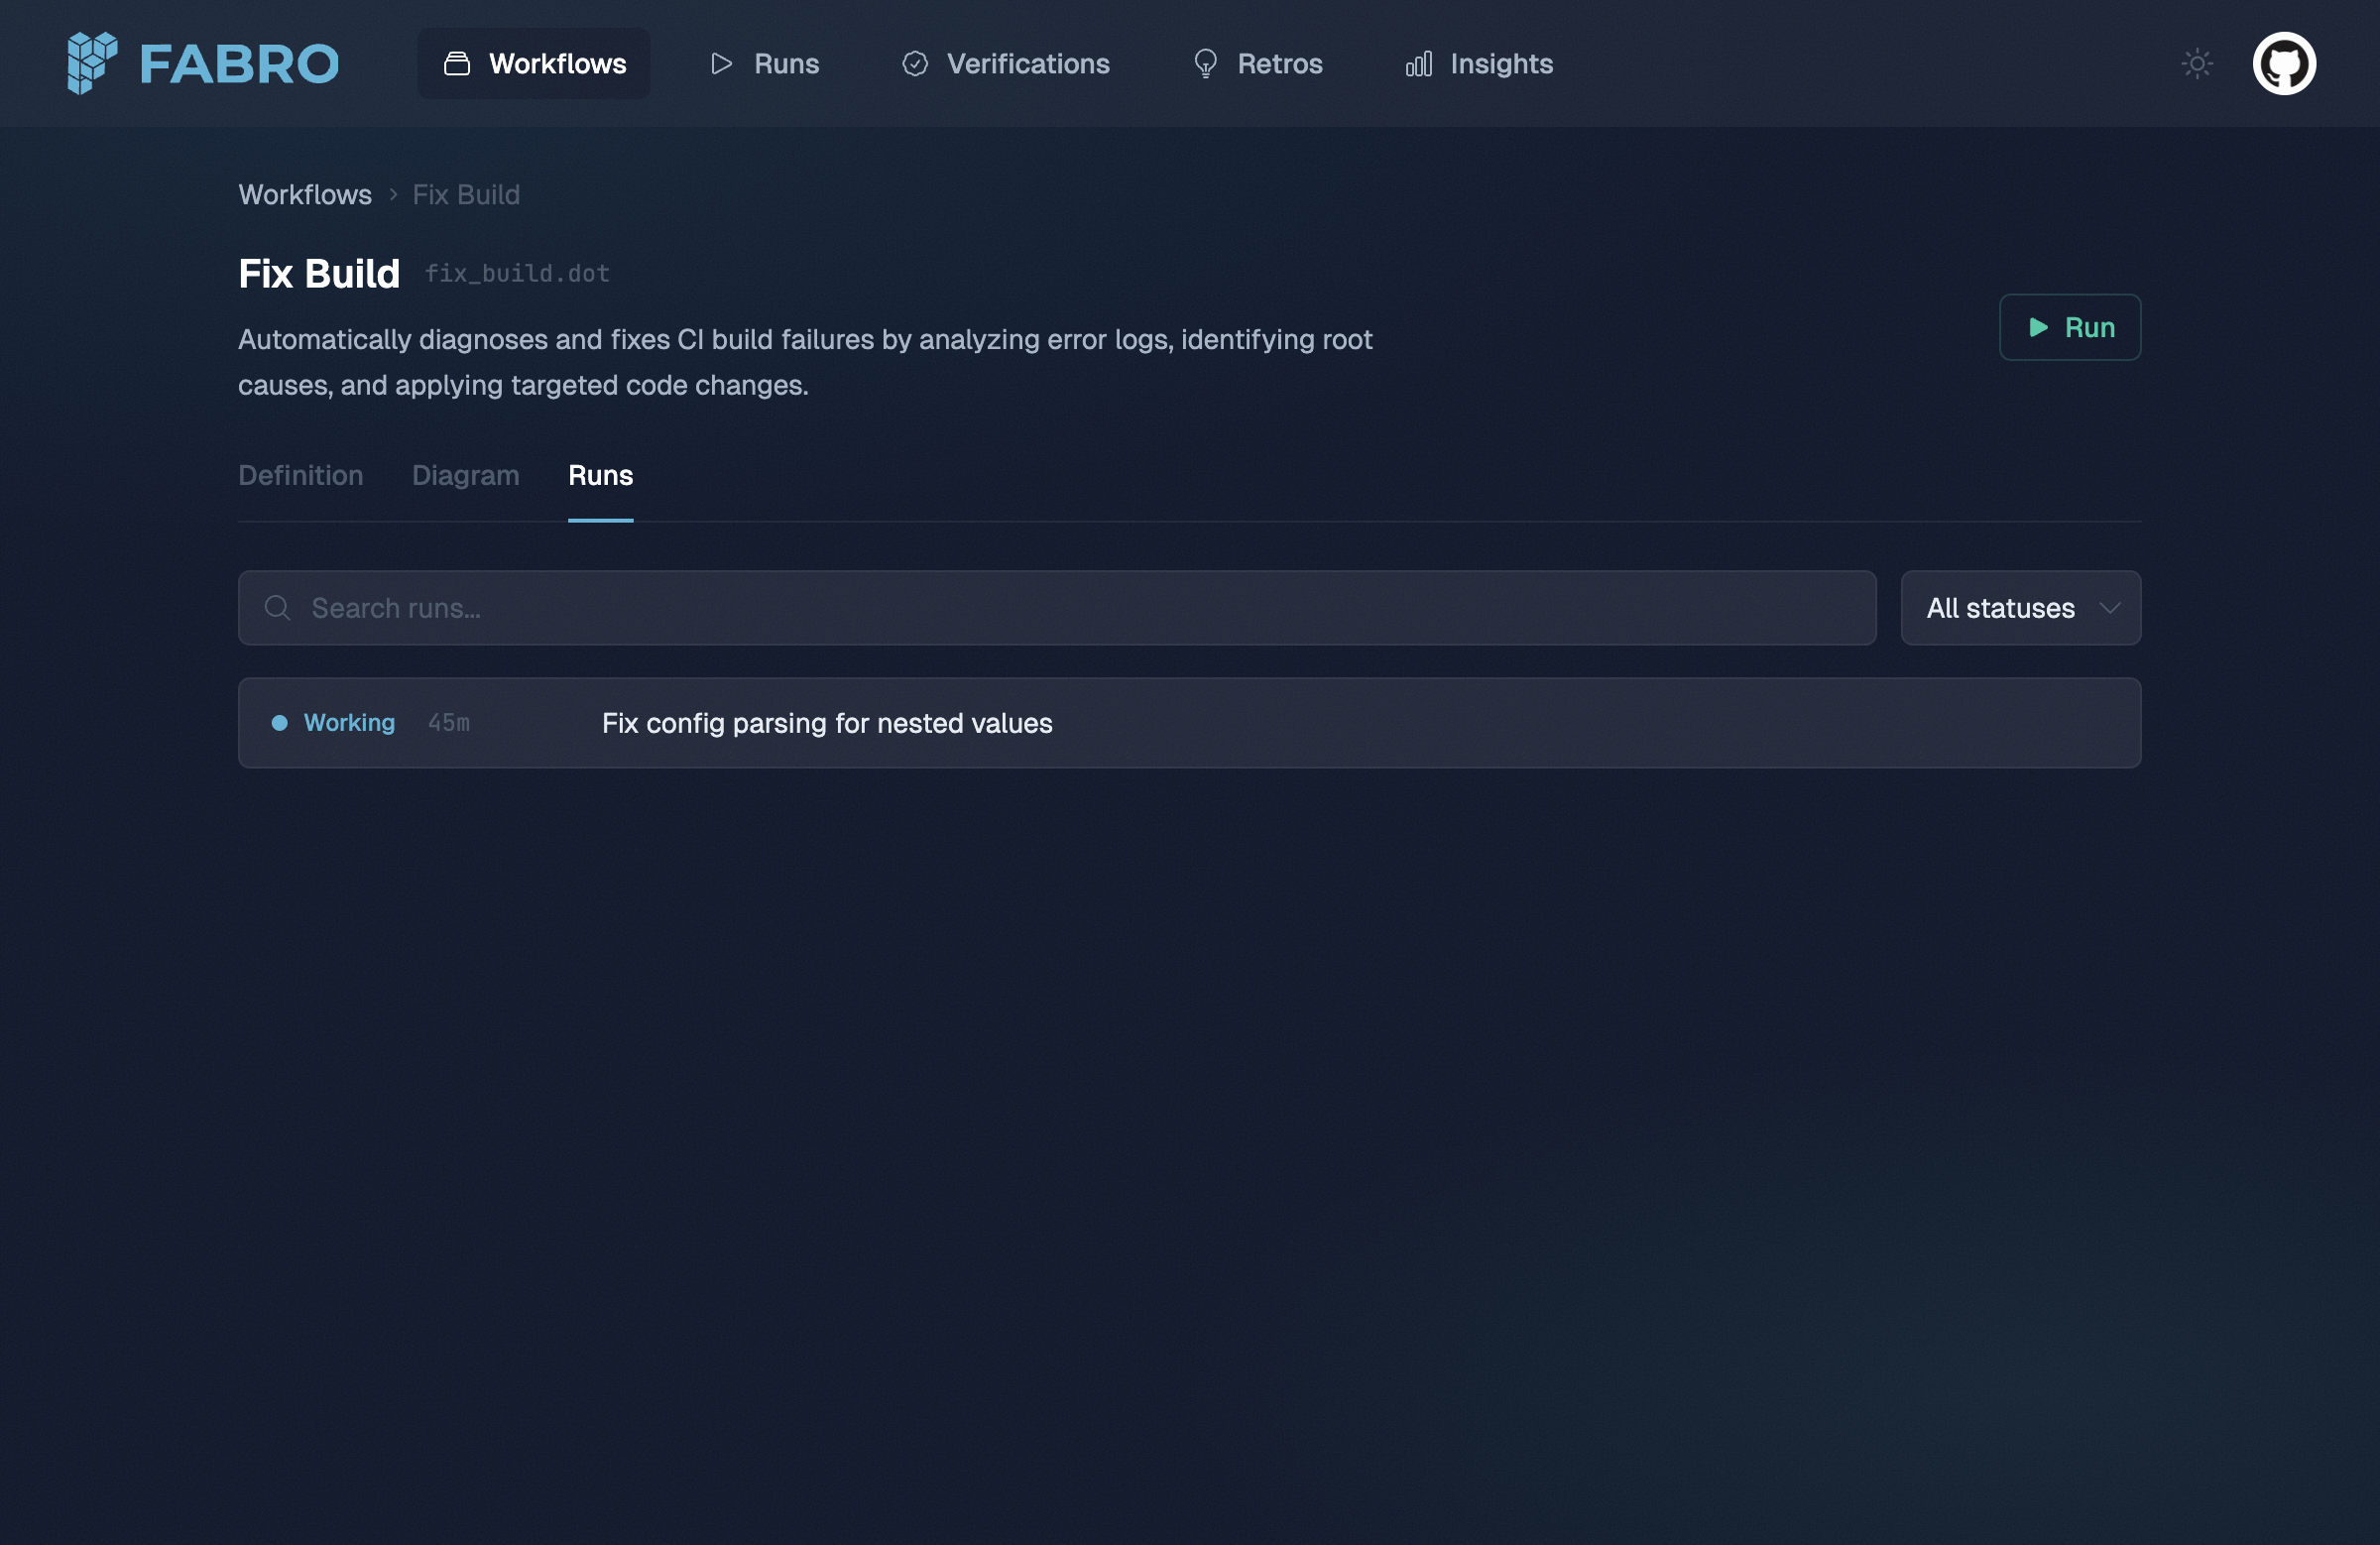
The Runs tab shows all runs for this workflow, filterable by status.
Select workflow source and run target
fabro run and fabro create accept the same source and target options. create
registers the workflow and leaves a submitted run for you to start with
fabro start RUN. run also starts it, then attaches unless you pass --detach.
The required positional argument selects the workflow. Local names are found in
the current checkout, then a marked project, then installed user workflows.
Explicit local paths retain their usual package roots.
acme/workflows, and the
run works on acme/app. Neither selection changes the other. Local workflow paths,
--goal-file, and other caller inputs still resolve from the invocation context.
Without target flags, Fabro keeps its existing cwd/environment-based target
inference.
Remote workflow shorthand is OWNER/REPO[@REF]:WORKFLOW. The workflow selector
is required: acme/workflows:review selects a named workflow, and
acme/workflows@v1.2:./reviews/security.toml selects a file. Repository default
workflows are not supported; without :WORKFLOW, the positional argument retains
local lookup behavior. Prefix local paths containing a colon with ./, ../,
or / to avoid shorthand parsing. Shorthand cannot be combined with
--workflow-repo or --workflow-ref. Repository slugs currently imply GitHub.com.
--workflow-repo OWNER/REPO acquires source using native Git on your machine. A
workflow name selects .fabro/workflows/NAME/workflow.toml in that repository;
you can also supply an explicit repository-relative .toml or .fabro file.
Absolute paths, traversal, and directory selectors are rejected. A missing remote
workflow never falls back to a local or installed workflow.
--workflow-ref requires --workflow-repo. Omit it, or use HEAD, to select the
remote default branch. You can select a branch, tag, or full 40-hex commit SHA.
If a branch and tag share a name, qualify it with refs/heads/ or refs/tags/.
Fabro resolves the revision once, fetches that exact commit into a temporary
checkout, and registers its workflow-version closure. A moved or unavailable
commit never causes a fallback to a newer revision. Checkout hooks, content
filters, and implicit Git LFS expansion are disabled; submodules are not fetched.
Temporary files are removed after collection or failure. Interrupting acquisition
stops owned Git processes before cleanup; collection already in progress must
finish before its files can be removed.
For local workflows without target flags, the existing run.scm repository
configuration in workflow.toml or .fabro/project.toml still participates in
target inference, with workflow values overriding project values field by field.
For clone-based environments, the configured repository must match the checkout’s
origin. Without that configuration, omission is equivalent to --target-from ..
Explicit --target-from, --target-repo, and --target selections take precedence
over the configured repository.
Target selection depends on the environment:
For clone-based execution, a target path selects a repository, not a subdirectory
working-directory override. Local target files are not uploaded. Existing target
observation may push committed local changes to origin; dirty changes are
excluded from clone targets and produce a warning. Detached or unavailable exact
commits fail. Folder targets require the directory to be accessible to the
server and its Local execution environment; passing a caller-local path does not
transfer it to a remote server.
--target-branch requires --target-repo and accepts a working branch name, not a
tag or SHA. Without it, Fabro resolves the repository’s default branch. The CLI
only looks up target metadata; the execution sandbox clones the target.
The shorthand --target acme/app@release/v2 selects the working branch
release/v2; omit @BRANCH to use the remote default branch. Target suffixes
accept working branches, while workflow suffixes accept branches, tags, or SHAs.
--target, --target-from, and --target-repo are mutually exclusive.
--target-branch cannot be combined with --target.
Local Git credential helpers, SSH-agent access through configured URL rewrites,
and user network configuration govern source acquisition and remote target
lookup. Fabro server login does not grant local Git access. The execution
sandbox still needs its own target-clone credentials.
--dry-run simulates execution; it can still fetch and upload workflow source,
and existing local target observation can still publish committed changes.