Event stream
Every workflow run emits a sequence of canonical run event envelopes that are:- Stored durably in the run store
- Broadcast over SSE to connected API clients
- Stored for later analysis
- Rendered by CLI progress and log tooling
- Optionally materialized into JSONL by export/debug paths
Event names
Event names use lowercase dot notation, for example:run.startedstage.startedstage.completedagent.tool.startedagent.tool.completedsandbox.readytodo.updatedparallel.branch.completed
Envelope format
Each serialized event envelope has a stable JSON shape:
Only
id, ts, run_id, and event are always present. Optional fields are omitted when they do not apply.
Reading the event stream
Because event payload lives inproperties, most shell queries should look there.
fabro dump exports events.jsonl plus run-state projections.
Event categories
Common categories include:agent.message is the canonical post-response event for agent turns. When context-window data is available, it appears on the message payload as context_window; there is no separate context-window snapshot event to consume.
Sub-agent visibility
Sub-agent activity now appears as normal agent events with session linkage:session_ididentifies the child sessionparent_session_ididentifies its immediate parent
agent.sub.spawned and agent.sub.completed are emitted by the parent session. Tool calls and other child activity are forwarded with their original session_id.
Real-time monitoring
API: Server-Sent Events
When running workflows through the API server, subscribe to the run events endpoint. Each SSE payload is a serialized run event envelope in the same shape used byfabro events and events.jsonl exports.
Web UI
The web frontend consumes the SSE stream automatically and shows stage progress, tool calls, command output, and human interaction as they happen. Use the stageThread and Debug views for per-stage activity, or the run-level Run Events page when you need the full event stream with search and category filters. The Run Events page also includes a Waterfall view for comparing stage durations and inspecting timing details from hover popovers.
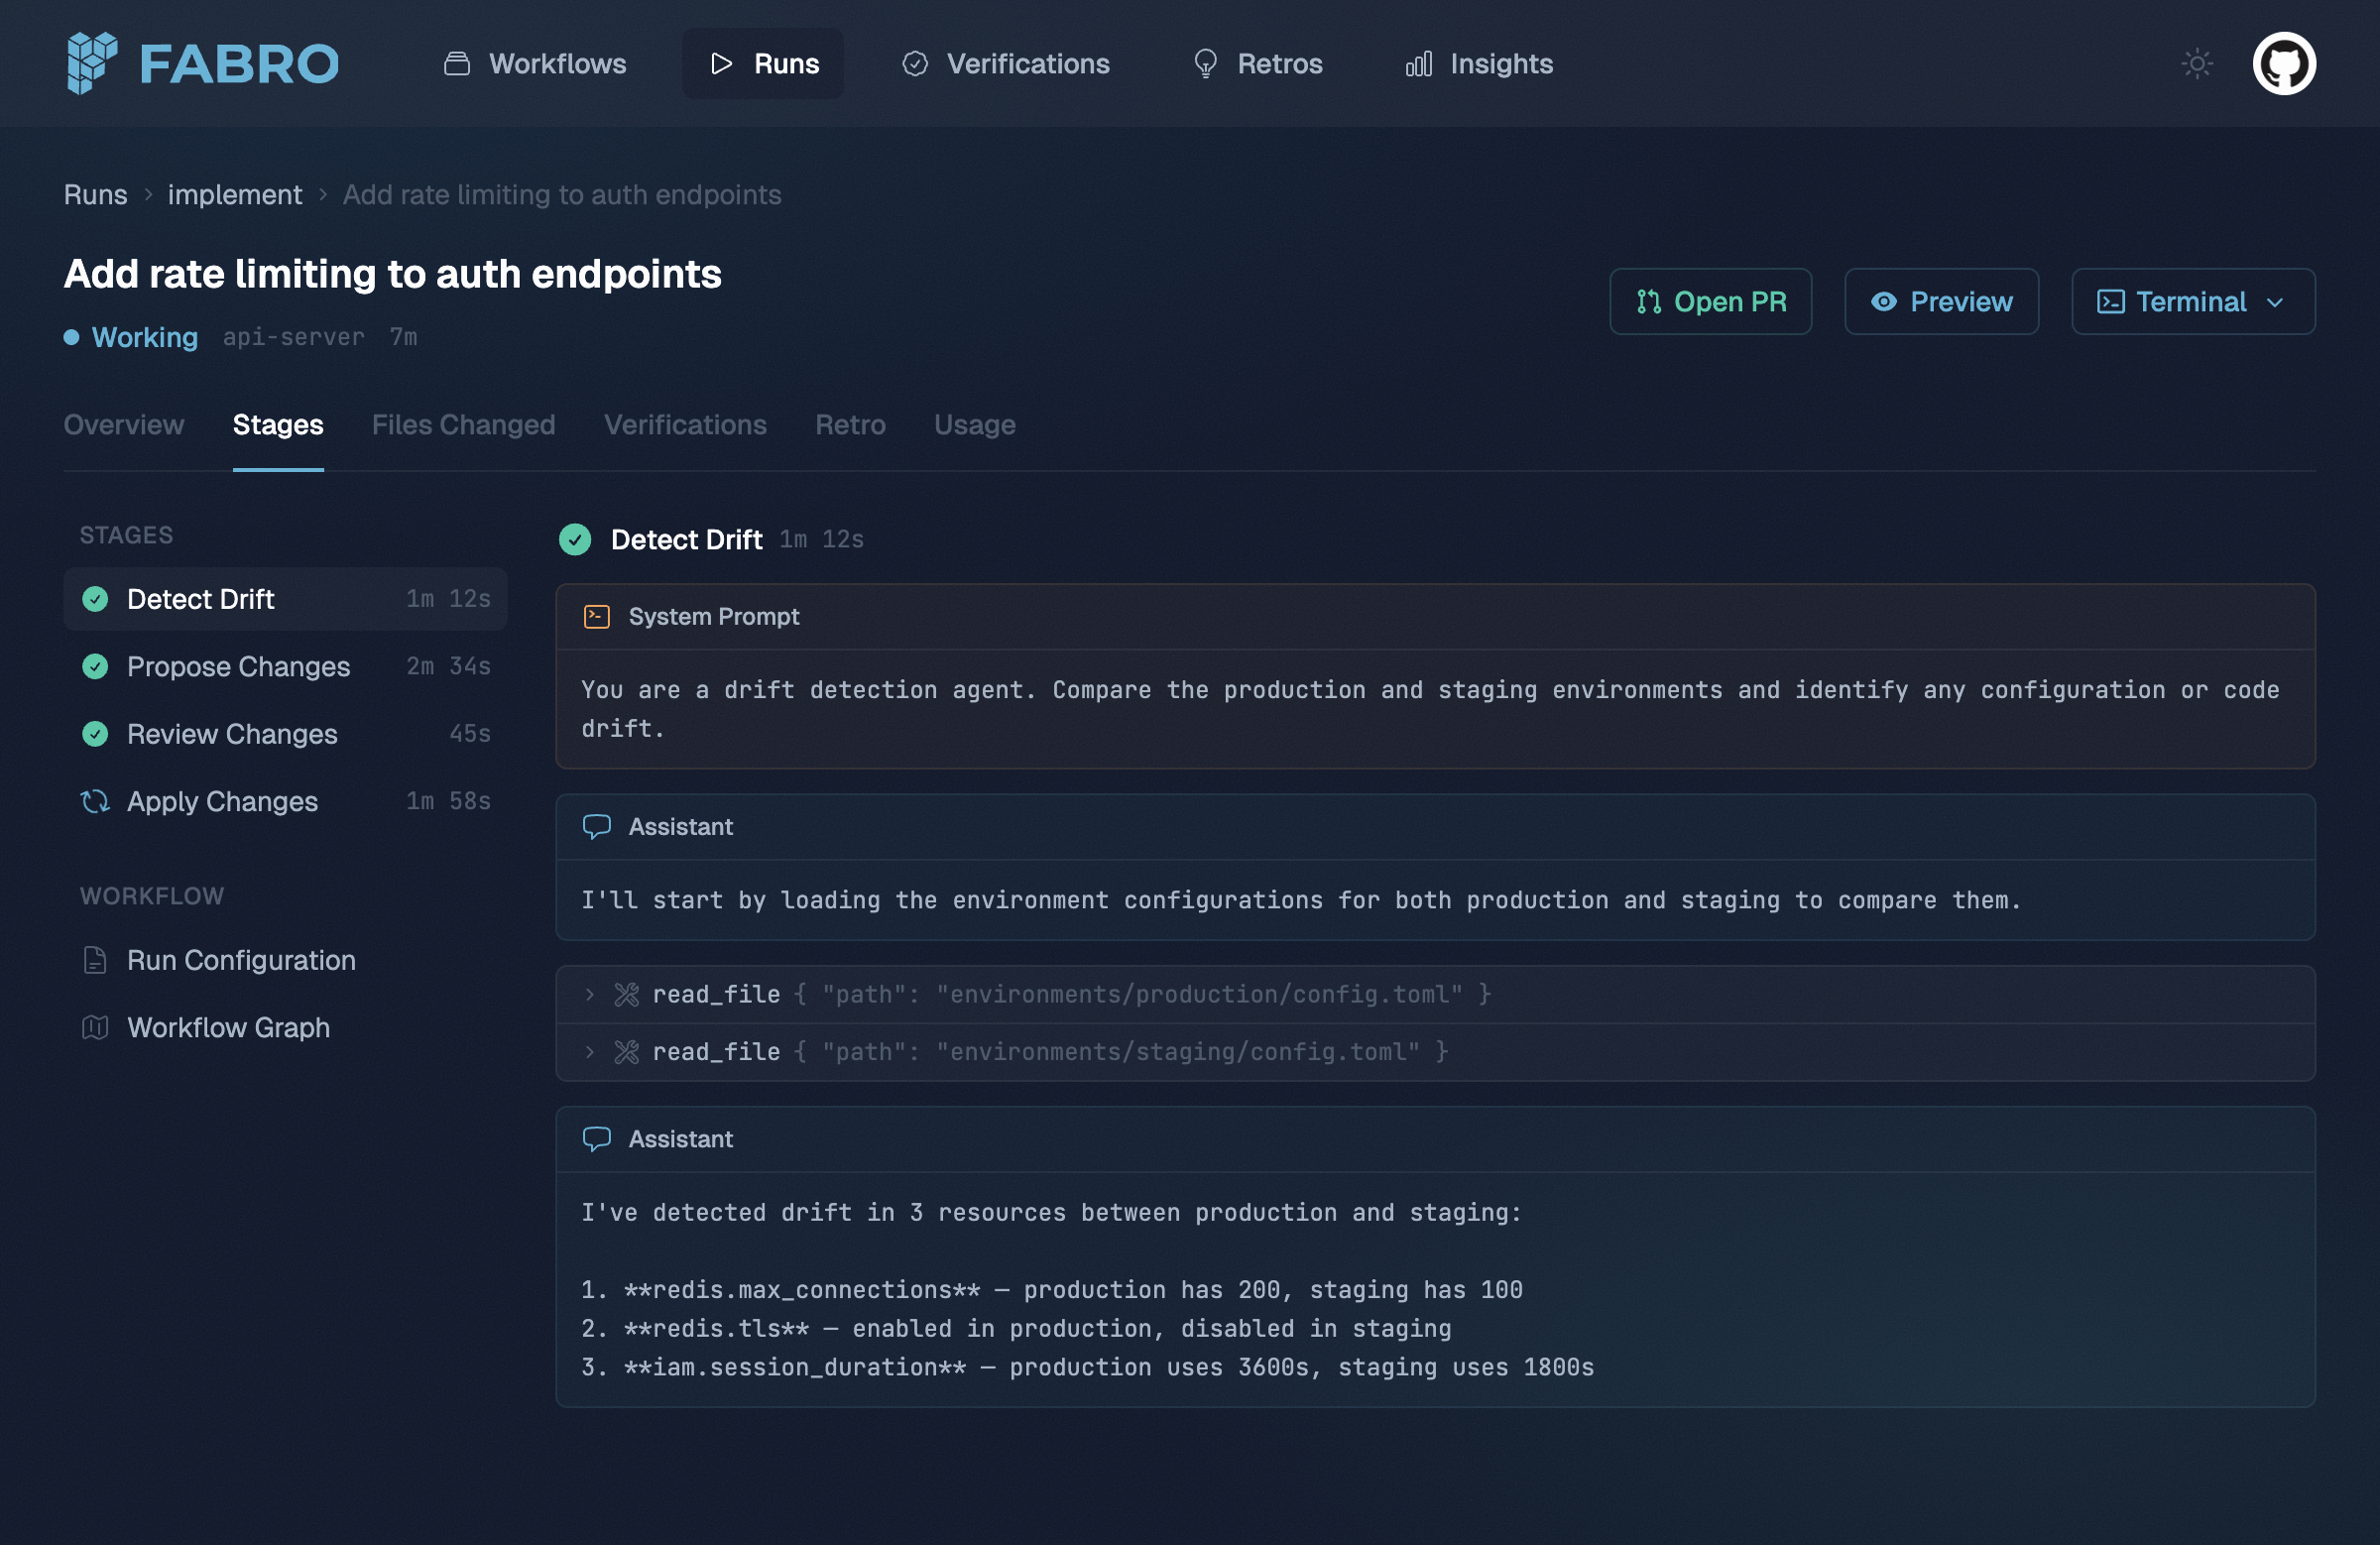
The Stages tab shows the full agent conversation including tool calls and responses.
CLI progress
The CLI renders live progress from the same envelope format. This is written to stderr so stdout remains pipe-friendly.Post-run analysis
Post-run analysis surfaces include:
See stages and turns for higher-level analysis views built on top of this event stream.